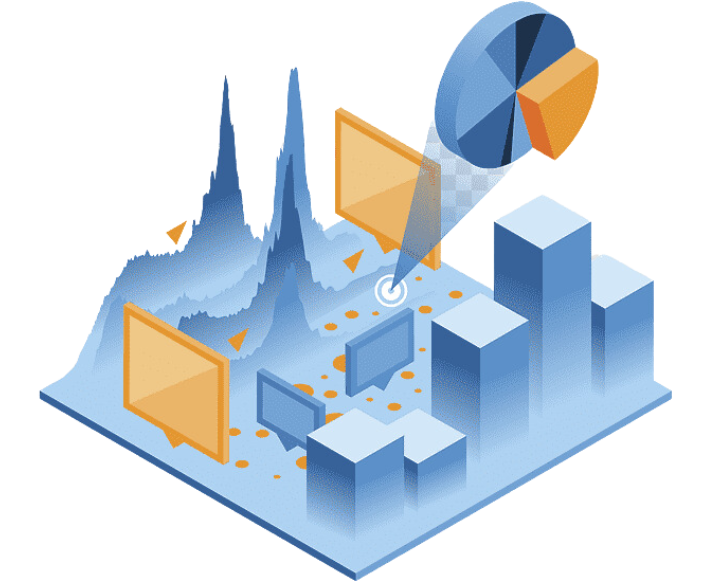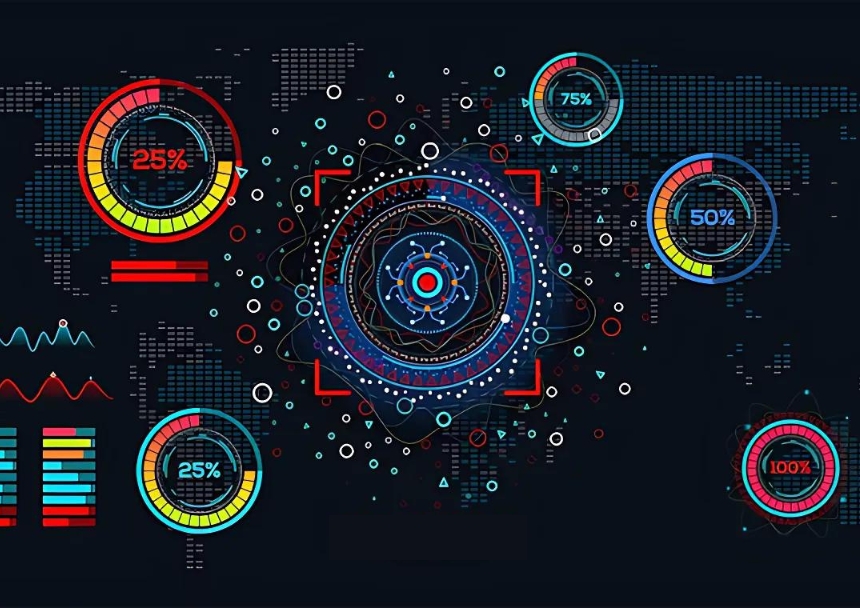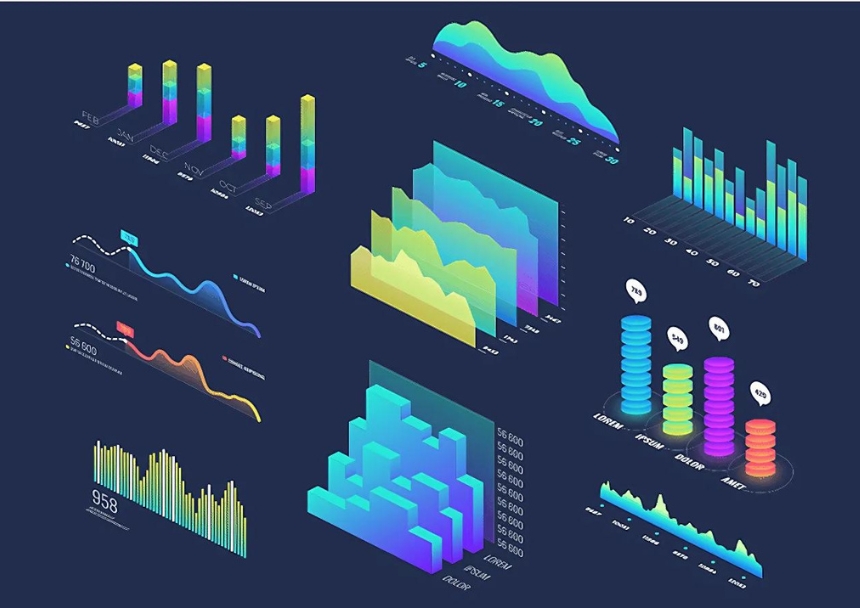
In today’s data-driven world, the ability to understand and interpret complex data is crucial. Our Data Visualization services make it easier for businesses to turn raw data into meaningful insights. We leverage advanced tools and cutting-edge techniques to create visual representations that tell a story, providing a clear view of trends, patterns, and correlations hidden within vast datasets.
These visuals empower decision-makers by delivering intuitive, real-time data insights that help optimize business strategies and drive performance.

Our interactive dashboards are designed to provide you with up-to-the-minute data at your fingertips. From key performance indicators to detailed metrics, these dashboards allow you to monitor, explore, and analyze data in a visually engaging format. They are fully customizable, enabling you to focus on the metrics that matter most to your business. This empowers teams to react to changes swiftly and make informed decisions with confidence.


Visualizing data is not just about making it look appealing - it's about making it understandable. We simplify the complexity of your data by presenting it in clear, easy-to-grasp visuals. Whether you're tracking market trends, customer behavior, or operational performance, our data visualization solutions bring clarity to your data, highlighting key insights that would otherwise be overlooked. With our visuals, you can turn data into a competitive advantage, driving smarter business decisions.
This structure maintains a professional and clear tone while providing a comprehensive look at Mivi Digital Solutions’s Data Visualization services, offering insights, features, and detailed descriptions.